Recurring Revenue
The Recurring Revenue graph is used to assess the size and growth of the subscriber base and, consequently, the volume of business. It is similar to the Revenue graph, but provides a more linear version of revenue allowing expensive long-term subscriptions to be harmonised with lower priced subscriptions of shorter duration.
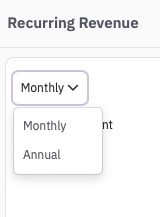
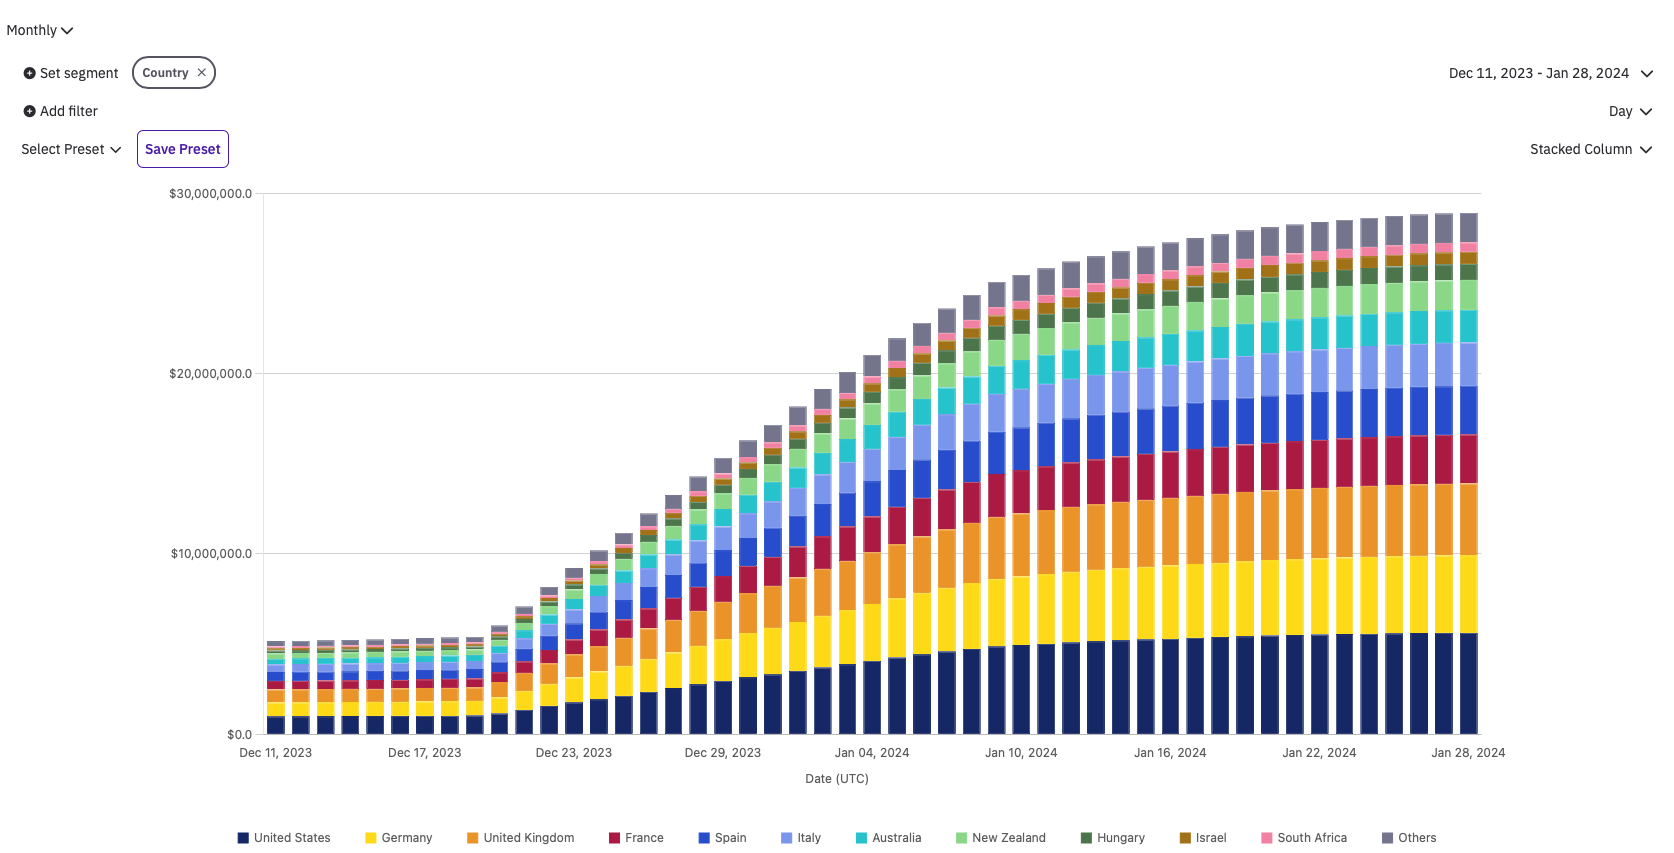
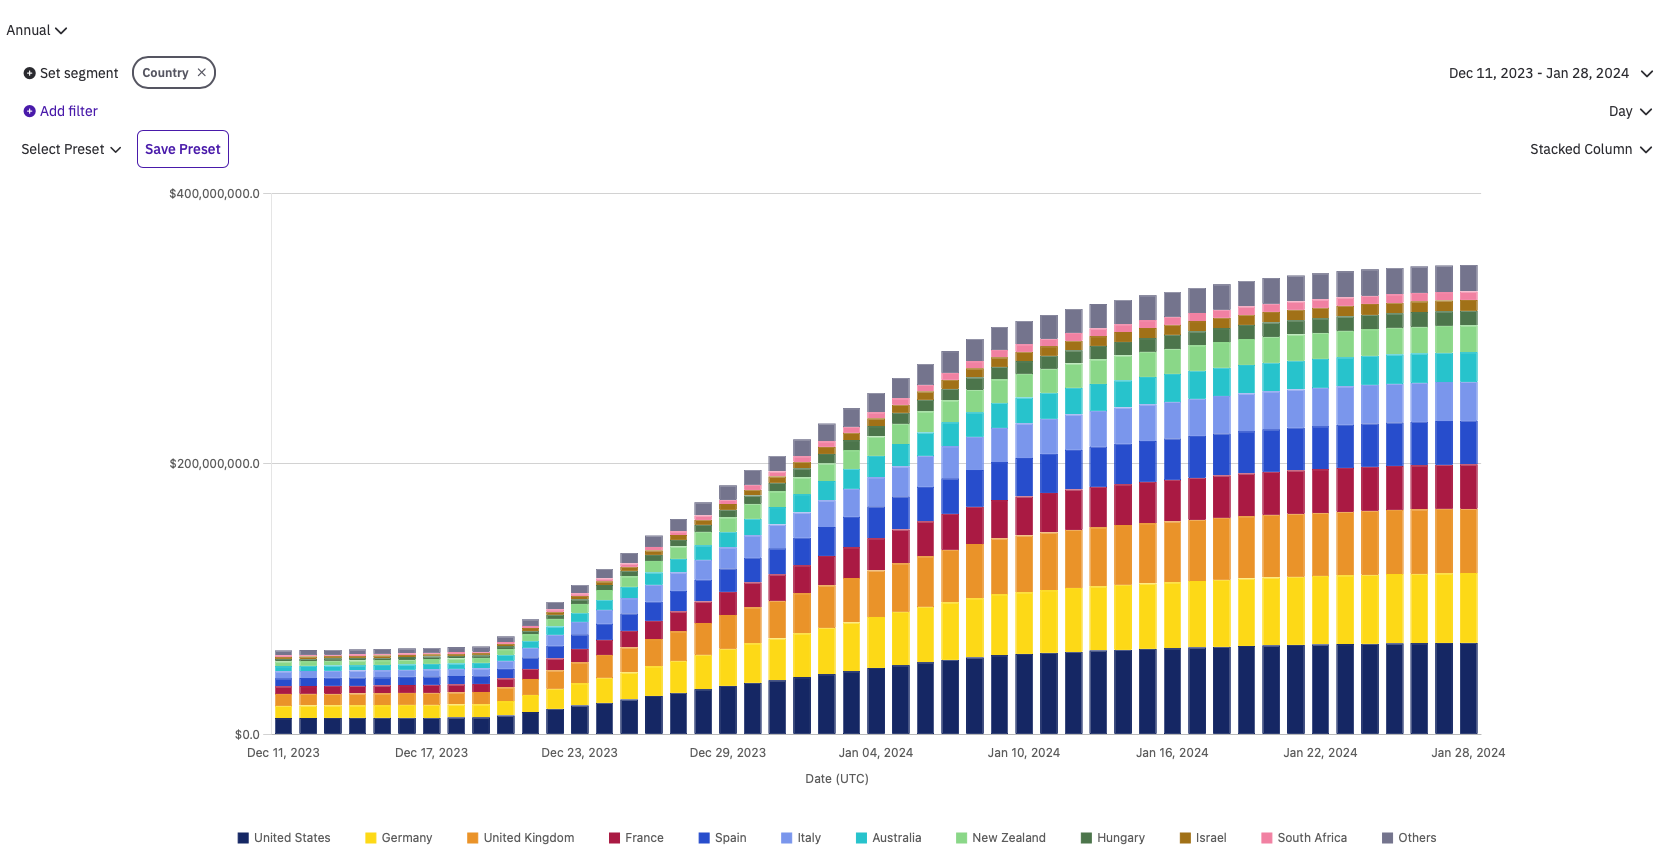
The Recurring Revenue metric has an option that lets you choose between Monthly Recurring Revenue (MRR) or Annual Recurring Revenue (ARR). MRR is the default for this metric.
By definition, MRR operates on a monthly basis, and in order to include revenues from subscriptions of different lengths, the normalization process is used: for example, if an annual subscription produces a revenue of $1200 in the MRR graph, it is counted as $100 per month.
In the normalization process the formula is used:
(subscription price) / (subscription duration) * 365 / 12
The ARR, instead, operates on a yearly basis, and in order to homogenise metrics the formula becomes:
(subscription price) / (subscription duration) * 365
In the formulas above, the subscription price and the subscription duration are calculated as an average over all active users by country_code, product_id and store, because price are different among products and, for a specific product, the price is generally different across different countries and different stores.
Once these data are available, we simply multiply the number of active subscriptions for each country, product_id, store by the respective recurring revenue contribution.
For the MRR we have:
Sum over country_code, product_id and store of active users * (subscription price) / (subscription duration) * 365/12
Likewise, for ARR:
Sum over country_code, product_id and store of active users * (subscription price) / (subscription duration) * 365/
In conclusion, the MRR and ARR help to understand where the revenue comes from, allowing you to focus your efforts on those subscriptions that have a higher return, and also providing information about potential imbalance situations such as, for example, getting 90% of the revenue from only 10% of the customers.
Updated 10 months ago