Experiment Dashboard
In the main page, on the right end of the experiment you can find three dots that open a menu.
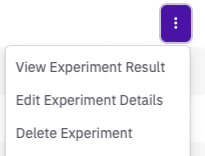
By clicking on View Experiment Result you can access the Experiment Dashboard
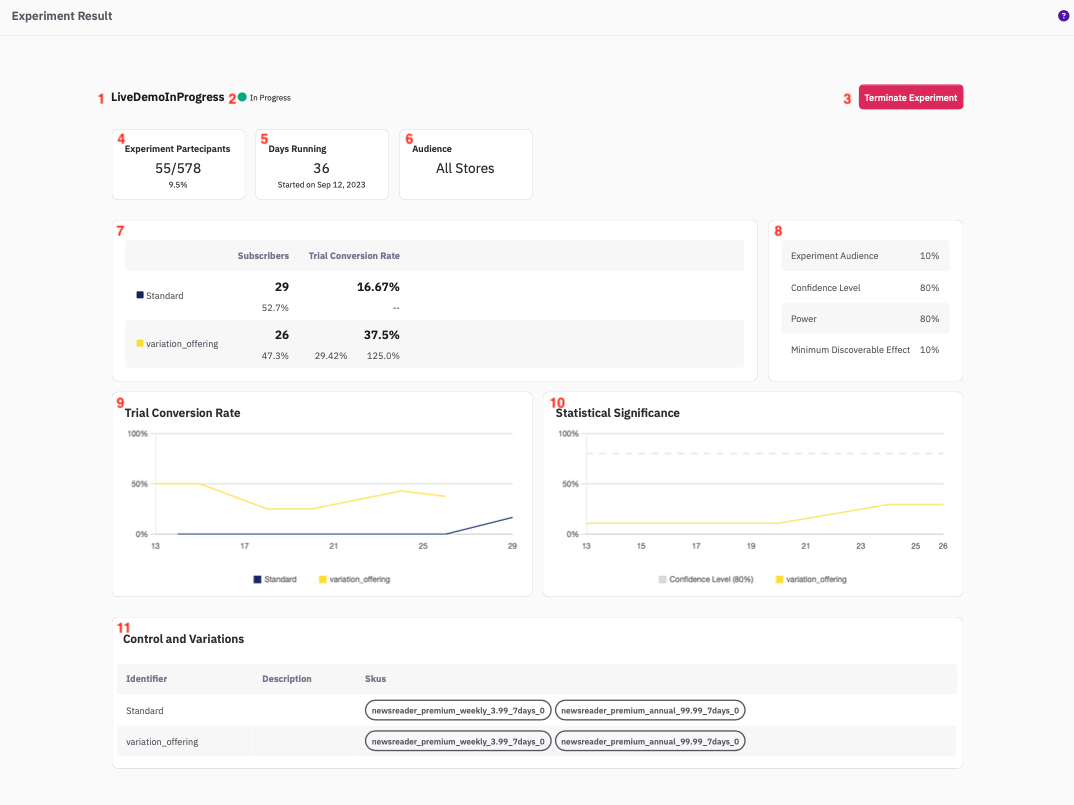
On the dashboard you can find the following elements:
- Name of the Experiment
- Status of the Experiment: the status indicates what stage of the workflow the experiment is in. It can take value as:
- draft: the experiment has been created but not yet scheduled to start. You can still edit the details of the experiment while it is in a draft status;
- scheduled: the experiment is scheduled to start on the date indicated. When you create an experiment, you can choose to schedule it as soon as the day after. Once an experiment is scheduled, it cannot be modified anymore;
- in progress: the experiment is running;
- data crunching: the experiment collected the required number of qualified participants but there is not yet enough data to make a decision and some of the users still only have partial data. The experiment is still running, but no more participants are being recruited;
- interrupted: the experiment was interrupted by the user. It goes in data_crunching mode in background, until all data are collected for the currently enrolled participants;
- concluded: the experiment is concluded either if the statistical significances goes above the threshold at any time, or if no evidence is found in support of the control even after the data_crunching period.
- Terminate Experiment: at any time you can terminate the experiment using this button. The experiment will cease to enrol users and the status of the experiment will be set as interrupted.
- Experiment Participants: the number of Recruited Users who are participating in the experiment. You can also see the Expected number of participating Users (the Size of the experiment) and below you find the Recruited Users as a fraction of the Size.
- Days Running: the number of days this experiment has been recruiting new users since the Start date reported below.
- Audience: if any filtering on the New Users is applied before they are recruited, it is reported here.
- Summary of Results: in this table you cans see the Subscribers in each group as a number and as a percentage of the total. On the next column you can see the value of the control metric for each group. For each variation, you can see the percentage variation with respect to the control metric for the control group (right below the metric value) and the statistical significance of this difference (on the left).
- Parameters and Details Recap: this is a recap of the parameters assigned for the Statistical Test, i.e. Confidence Level, Power and Minimum Discoverable Effect, together with the Experiment Audience, i.e. the percentage of new users participating to the test.
- Control Metric Chart: this chart shows the control metric (the Trial conversion Rate in this example) as a function of the number of enrolled users.
- Statistical Significance Chart: this chart shows the statistical significance of the difference in the control metric between the control group and the variation group as a function of the number of enrolled users in each group (whichever is lower).
- Control and Variations Recap: this is a recap of all the SKU that compose each offering in the experiment.
Updated 10 months ago