Getting Started
In this section, we'll walk you through the initial steps to set up the platform and conduct your first experiment.
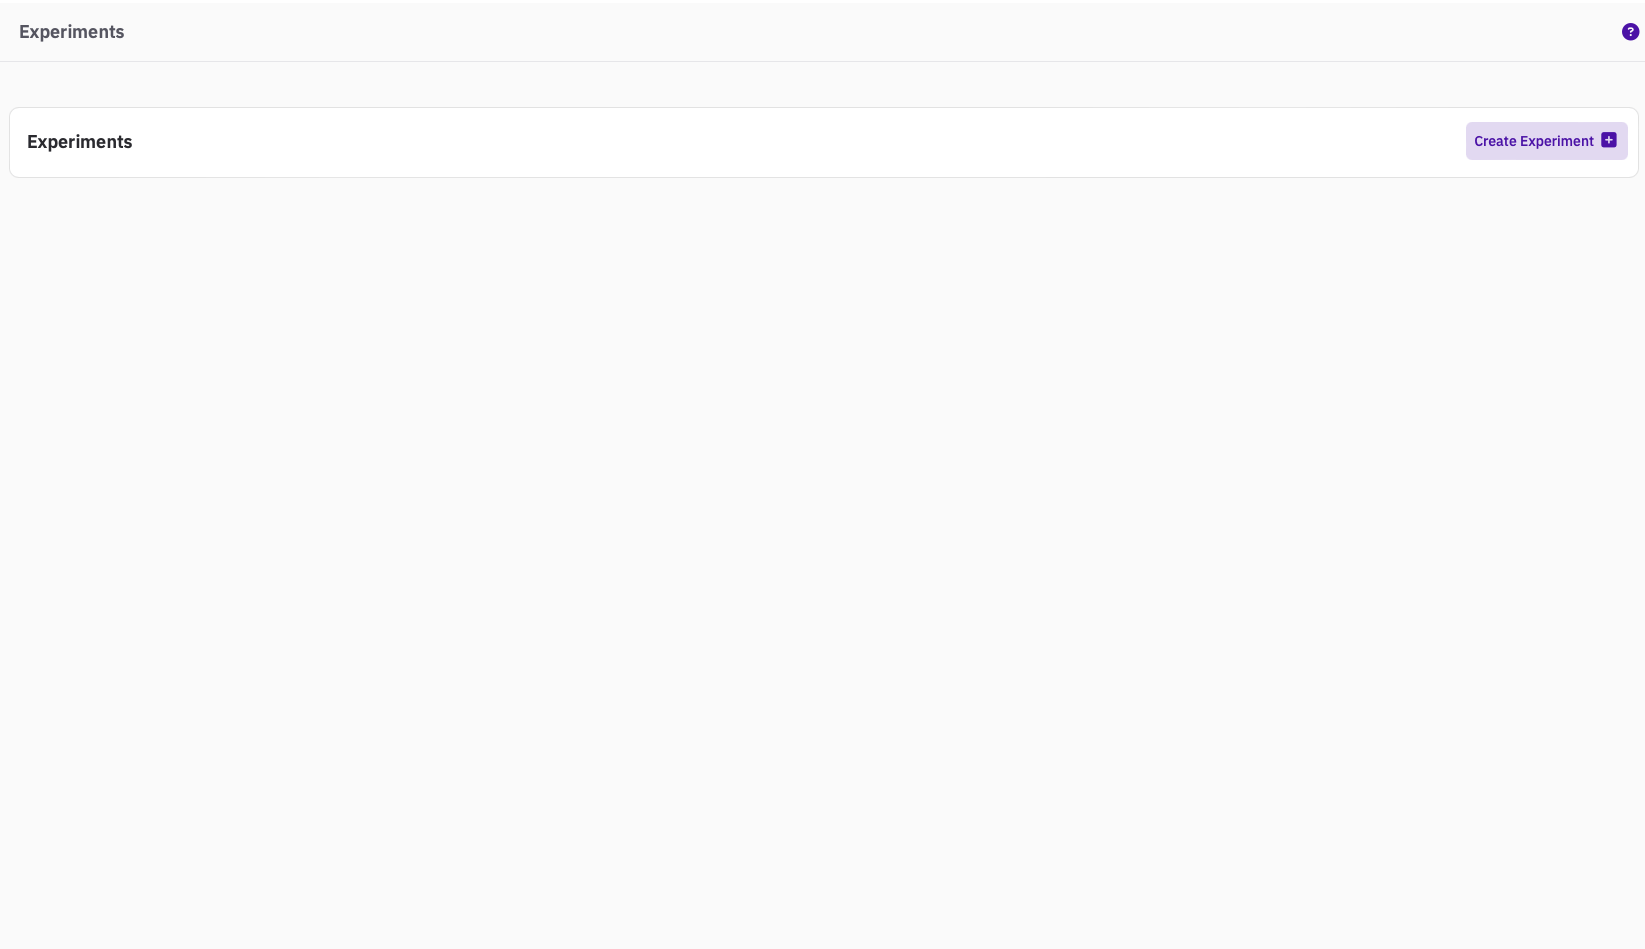
If your app is enabled to the Experimentation Platform functionality, the tab Experiments will appear on the sidebar and you can use it to access the Experimentation Platform.
This is what your page will look like when you access the Experimentation Platform for the first time:
Creating your first experiment
Creating an experiment is a matter of minutes.
Create Experiment
To create an experiment, just click on the Create Experiment button, in the upper right corner of the page.
You get the following window, where you are prompted to input some information
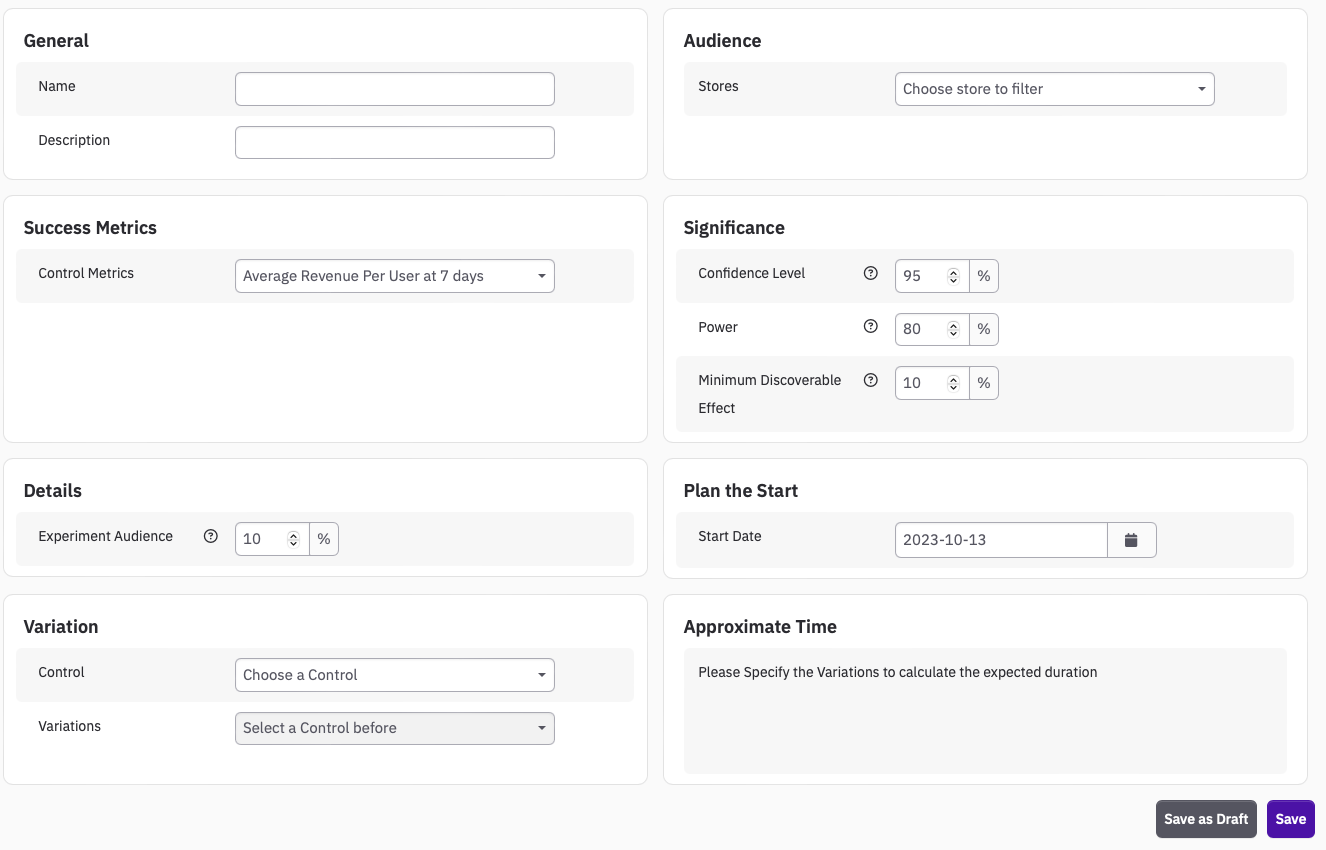
General
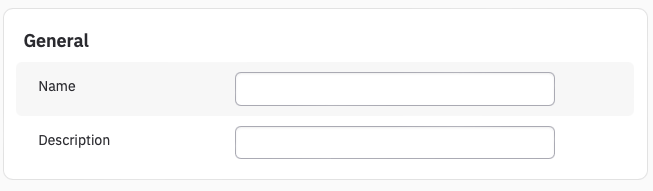
Here you just need to input the name you want to assign to this experiment, and a description of what you are trying to accomplish. Try to use descriptive names, and do use the Description because in a few weeks time you might not remember all the details related to the experiment.
Audience
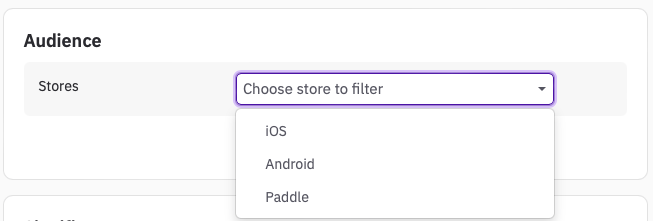
Currently you only have the option by Store.
If you select a Store, the experiment will only be run on that store. If you don't select anything, the experiment will be run on all stores.
Success Metrics
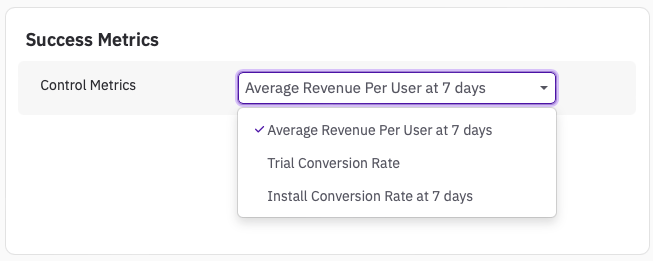
You can currently select only one Control Metric.
This metric is the one that you are going to be able to see in the dashboard and it is going to be used to establish statistical significance for the test.
Significance
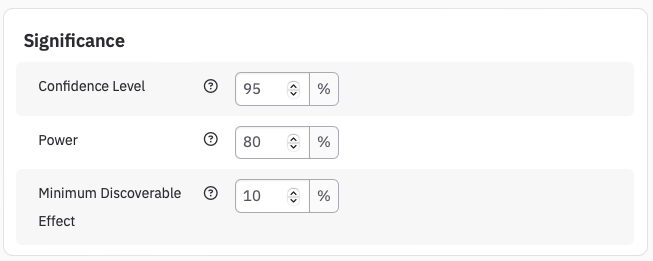
These parameter are more technical. We have pre-populated them with typical values and you can skip ahead if you don't know what they are yet, or don't want to tweak them.
They are necessary to be able to calculate a sample size and an estimate duration of your test.
Confidence Level
Intuitively, the Confidence Level can be interpreted as how confident you are that the difference you observe is a real effect. Thus, if you set it at 95%, you want to stop the test when you are 95% confident that the difference you are observing is real.
More formally, the alpha = significance level = 1 - confidence level is the probability of Type I Error, or false positive. It can be interpreted as the probability of observing a significant effect while there isn't any.
The higher is the Confidence Level, the higher the sample size for the experiment is going to be.
Power
Intuitively, the Power can be interpreted as how good a test is at finding a difference between the variations when there is one.
More formally, beta = 1 - power is the probability of Type II Error, or false negative. It can be interpreted as the probability of not observing a significant effect while there is one.
The higher is the Power, the higher the sample size for the experiment is going to be.
Minimum Discoverable Effect
The Minimum Discoverable Effect (MDE) sets the minimum percentage difference that the Success Metric must display in the variation with respect to the control. A percentage difference smaller than the MDE will not be considered significant.
Details
The Experiment Audience sets the proportion of new users that will be enrolled in the experiment.
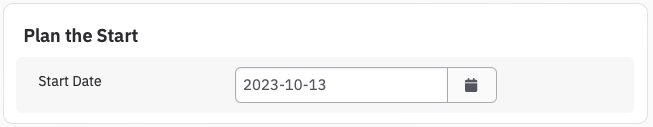
Plan the start
Once a test is Saved, it's scheduled to start on the date you specify here.
The minimum date you can specify for a test to start is 00:00 AM tomorrow.
Variation
Here you must select the Control offering and the Variation offerings.
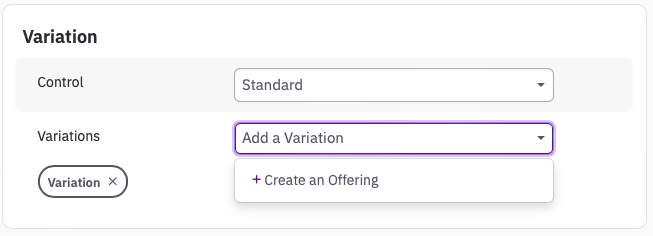
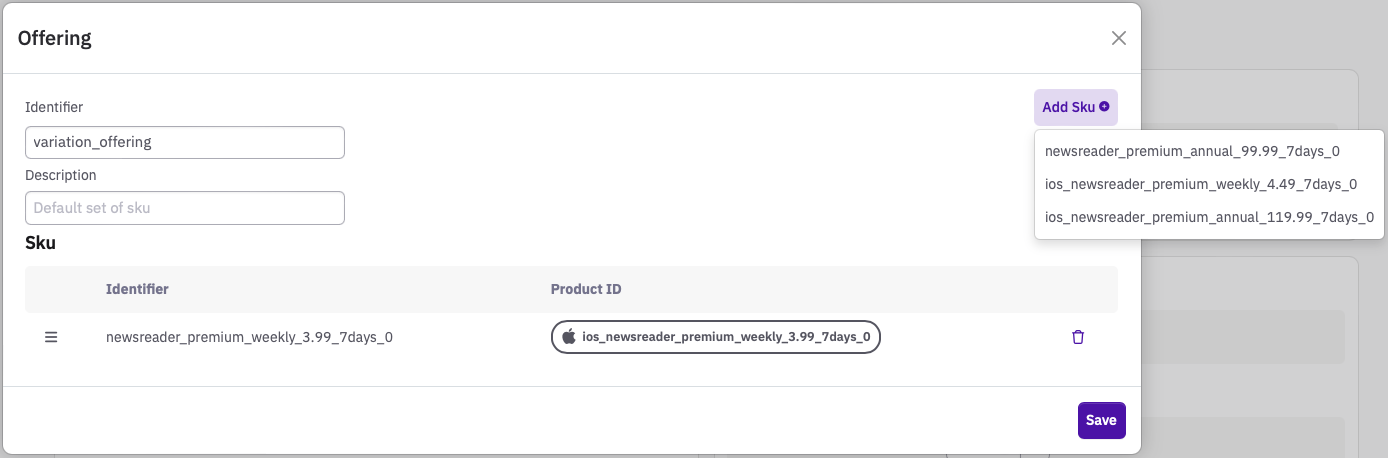
If you have not pre-built the variation you intend to use in this experiment, you can create one directly from here.
A window is going to appear where you can give a name to the offering and add the single SKUs that are going to be part of it.
Approximate Time
This box gives you a message with some important information that will help you understand if a test is properly set and suitable for your goal and situation.
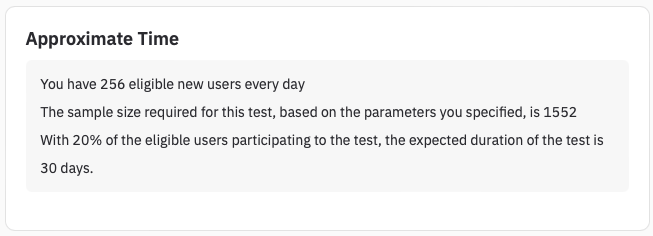
Eligible Users
Eligible users are generally the New Users you get every day. Based on the type of metric you choose, you might be in a different part of the funnel, and this number might assume a different interpretation. Furthermore it is also filtered based on the audience you set at the top (i.e. Store).
For example, for the Trial Conversion Rate this number represent the average daily number of New Trials you've had in the last few months. If you consider the Install Conversion Rate, this number represent the average daily of New Installs you've had in the last few months.
Sample Size
This is calculated based on the parameters specified in Significance. The higher the Confidence Level and the Power are, the higher the Sample Size will be. The lower the MDE is, the higher the Sample Size will be.
Duration
Duration is calculated by the simple formula:
Duration = Sample Size / (Eligible Users * Experiment Audience)
It gives you an estimate of the time it will take for the experiment to enrol Sample Size users.
Updated 10 months ago